A vast amount of commodities are traded across the globe. There are markets for metals like gold and lead, agricultural products like coffee and cattle, forest products like lumber and pulp, and – of course – energy products like crude oil, natural gas, and electricity.
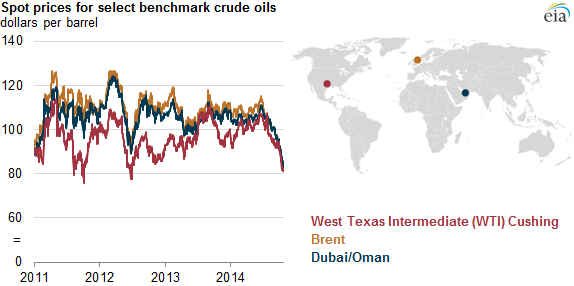
Credit: US Energy Information Administration
But electricity has several key characteristics that other commodities lack. Electricity is consumed and produced instantaneously and cannot be stored, and electricity supply and demand must be kept in balance at all times to maintain the integrity of the grid. And while batteries and hydroelectric dams can help balance the grid, they can only do so in limited quantities in limited locations. These factors, combined with many, many constraints on the electric grid, result in a significantly more complex design for electricity markets than other markets. Electricity prices can also be extraordinarily volatile, particularly during periods of extreme weather.
In this post, I’ll give a high-level comparison of deregulated vs regulated wholesale power markets, the function of ISOs/RTOs, and the hubs and timelines from which electricity is bilaterally traded. Then, I’ll focus specifically on the design of wholesale deregulated power markets, with a focus on energy bids, the day-ahead, real-time, and ancillary services markets, the full-network model (FNM), market optimization algorithms like security-constrained unit commitment (SCUC) and security-constrained economic dispatch (SCED), and locational marginal pricing (LMP). Finally, I’ll provide some closing thoughts on how our power markets – and our bulk electric system as a whole – must evolve so that we can reliably provide energy at low cost while still meeting all of our decarbonization targets.
Deregulated (RTO/ISO) vs Regulated Wholesale Power Markets
Today in the US, there are two primary types of wholesale power markets: regulated power markets, where vertically-integrated utilities are responsible for the generation, transmission, and distribution of electricity, and, deregulated power markets, where these tasks are divided and generation companies compete to sell electricity in wholesale power markets at the lowest price.
There are 9 deregulated power markets across North America: the California ISO (CAISO), Alberta Electric System Operator (AESO), Southwest Power Pool (SPP), Electric Reliability Council of Texas (ERCOT), Midcontinent ISO (MISO), New York ISO (NYISO), ISO New England (ISO-NE), Pennsylvania-New Jersey-Maryland Interconnection (PJM), and the Independent Electric System Operator (IESO) in Ontario, Canada. These markets are run by non-profit entities known as RTOs (regional transmission organizations) or ISOs (Independent System Operators). Conversely, the Southeast and most of the Western US are regulated markets without a central RTO/ISO.
In regulated markets, utilities are vertically integrated and are responsible for power generation, transmission, and distribution to customers. For long-term power planning, regulated utilities produce an integrated resource plan, or IRP, showing the investment that is required for that utility to serve load while meeting certain reliability, cost, and clean energy mandates. In regulated markets, short-term power trading is done through exchanges or bilateral contracts with other utilities, as there is no centralized market maker or dispatcher like there is with an ISO/RTO.
In a deregulated market, power generation, transmission, and distribution are split between different entities. Power generation is handled by energy developers who aim to sell energy into the deregulated market at a profit. Distribution is handled by a “distribution utility” – a regulated utility responsible for distributing power to customers. Pacific Gas and Electric (PG&E) is a well-known distribution utility that used to be vertically integrated before California’s energy market became deregulated in the 1990s. Transmission, reliability planning, market operation, and oversight of the entire bulk electric system are handled by the RTO/ISO itself. Approximately two-thirds of U.S. electricity consumers live within an ISO or RTO.
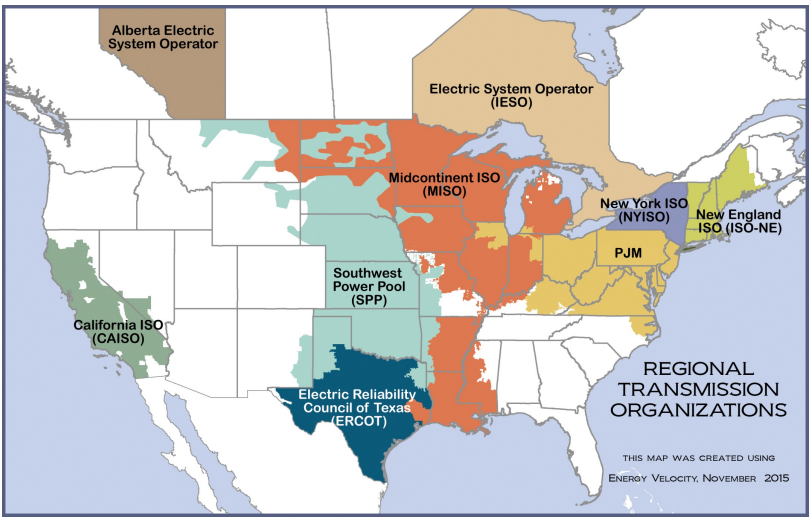
Credit: Federal Energy Regulatory Commission
For ISOs/RTOs, the tasks of operating the bulk electric system and running a deregulated power market often intertwine. For example, the 5-minute market that the ISO runs automatically changes the power output of generators in response to market prices via a system known as automatic generation control (AGC), and congestion is partially relieved via a pricing mechanism as locational marginal pricing (LMP), which we’ll focus on more later. In regulated markets, these responsibilities fall on individual utilities themselves, and due to the lack of a centralized combined grid operator/market maker, things like AGC and LMP don’t even exist. When talking about ISOs/RTOs in deregulated power markets, it’s important to remember the full range of services that an ISO/RTO provides and the potential synergies between these services.
ISOs and Grid Reliability During Periods of Extreme Weather
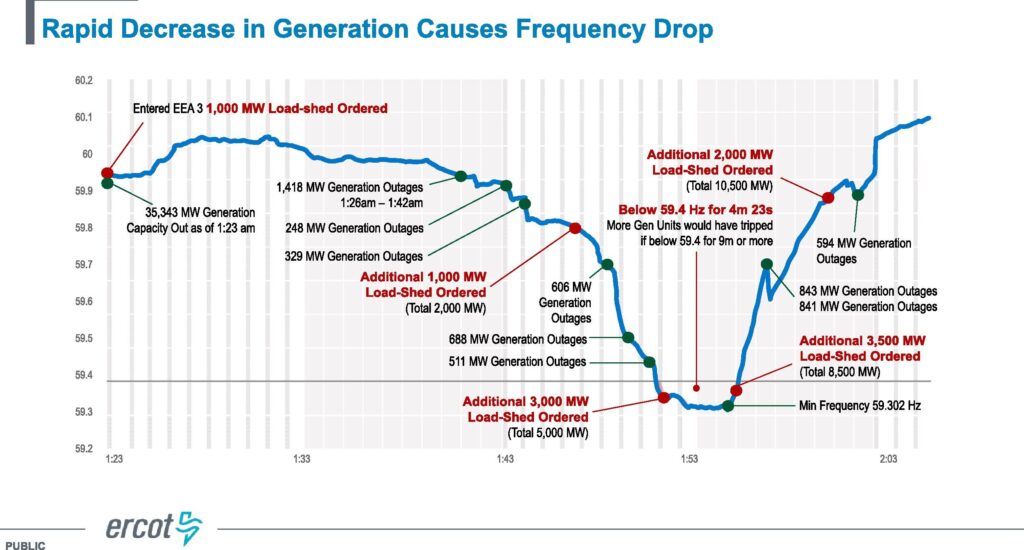
Several ISOs have made headlines for taking drastic actions to balance the electric grid during times of extreme weather. CAISO did so during September 6, 2022, when CAISO experienced its all-time record load and issued text alerts asking people to voluntarily conserve electricity to prevent the need for rolling blackouts. The texts worked and rolling blackouts were averted. But the most famous example in recent years is ERCOT’s actions during the February 13-17, 2021 winter storm, unofficially referred to as Winter Storm Uri, when ERCOT’s grid operators aggressively shed load to prevent the state from a catastrophic, months-long blackout.

Unfortunately, some of the blame for the Texas power outages was misplaced on the employees at ERCOT, when in reality their actions prevented the state from experiencing a catastrophic, months-long power failure. The outages occurred because ERCOT’s gas infrastructure froze up, and ERCOT, being a separate grid from the rest of North America, was unable to import large amounts of electricity to make up the generation shortfall. But that’s a topic for a different blog.
The power outages were primarily caused by a supply shortfall of natural gas production when unwinterized natural gas wells froze up and secondarily caused by components at the turbines themselves freezing up. When turbines went offline due to frozen parts or a lack of supply, gas wells and pipeline compressor stations lost power, making it impossible to produce/deliver additional gas and causing a vicious cycle of lower gas production/delivery and increasing power outages.
A note about system frequency: the system frequency over the North American power grid is designed to be 60 hertz, and when frequency drops too low below this, electrical equipment can sustain damage and will automatically shut off from the grid to protect itself. This results in “cascading blackouts” that can completely shut off the power grid. Subsequently, because plants cannot restart using power from the grid, they will need “black starts” to become operational and must be gradually brought back online.
Image credit: ERCOT, retrieved from Busby et al. (2021)
Electricity Trading Basics
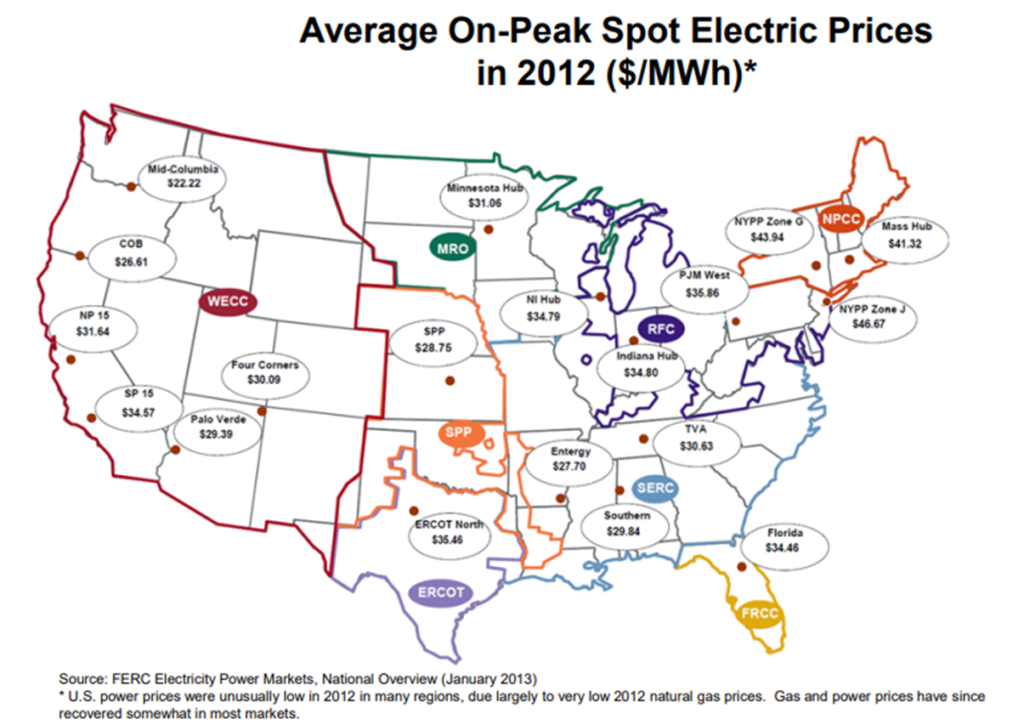
Just like oil, electricity is traded at multiple locations. These locations often have significant price differences due to constraints on the electric grid. In 2012, the Mid-Columbia hub had the cheapest on-peak pricing in the nation, as 2011-2012 was a massive snow year for the Columbia River Basin and provided tons of cheap hydroelectric power on the Columbia River System.
There are many different products that can be traded at these hubs. In addition to physical power, traders can trade a wide variety of derivatives, such as swaps, futures, and options, that can either be settled financially or with physical power. Delivery dates for power at these hubs range from intra-day, to day-ahead, all the way out to several years in advance.
Utilities and power marketers will buy multiple products over multiple time frames in these markets to procure adequate power and manage risk. For example, a vertically integrated utility in a regulated market may purchase a monthly block of 1000 MW for the entire month of November over a year in advance to combine with their native generation to serve load. As November approaches, they’ll continue monitoring market prices and their energy needs and make continued purchases/sales to manage their portfolio and hedge risk. Once they are in November, they’ll fine-tune their portfolio with additional sales/purchases in the day-ahead market to meet load based on day-to-day variations in supply and demand, and when it comes time to serve power in real-time, they will trade additional power in hourly blocks. Most of the long-term and day-ahead power trading is done on exchanges like ICE, while real-time power trading is done in bilateral OTC contracts without a central exchange.
The prices for power traded bilaterally or on these exchanges are simply based on bids and offers from various buyers and sellers. ISOs/RTOs, however, host their own power markets that use optimization algorithms to find the least-cost power on the system and deliver it to a buyer. By automating and increasing the efficiency of transacting, deregulated power markets have reduced the need for short-term energy traders to manually shuffle electricity around the grid and have largely automated this process, and they have substantially increased the ability to integrate renewables into the system.
The Components of Deregulated Power Markets
There are four major markets within deregulated power markets: (1) the day-ahead electricity market, (2) the real-time electricity market, (3) the ancillary services market, and (4) the financial transmission rights market. Financial transmission rights are strictly used for hedging price risk due transmission congestion, so I will not focus on them in this post.
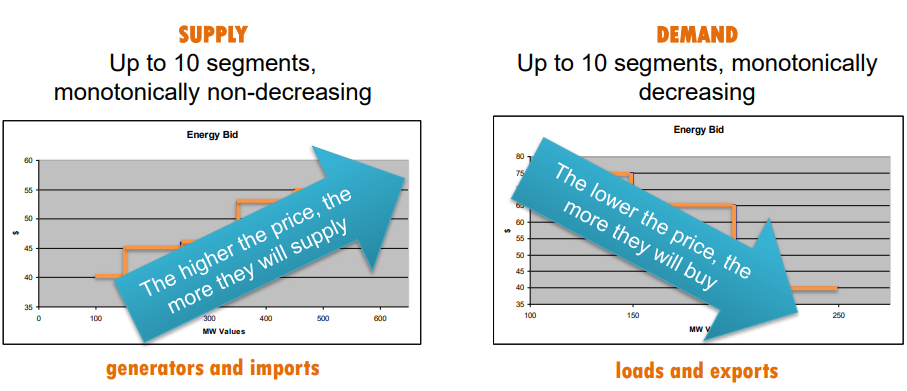
The deregulated day-ahead electricity markets revolve around the concept of daily power auctions. In a daily power auction, each market participant submits an “energy bid” to the ISO that contains (1) the amount of MW that will be imported (sold to) or exported (bought from) the ISO, and (2) the price at which the willing to provide that power. These energy bids usually have several individual “segments,” and an energy bid with several segments is known as a “bid curve.”
There are two types of bid curves: supply curves and demand curves. Supply curves tell a resource to supply more electricity into the ISO when the prices are higher. This is particularly useful for resources like natural gas or hydroelectric plants, as natural gas plants are highly flexible and can reduce their generation during periods they are unprofitable to run. Likewise, utilities may want to only produce hydroelectric power during periods when the price hits a certain threshold and may prefer to store water behind a dam during lower-priced periods. Demand curves, on the other hand, instruct a market participant to buy more energy when prices are cheaper.
Credit: California ISO
The Integrated Forward Market
After all the supply and demand bids have been submitted to the ISO and the ISO runs some tests to ensure these bids do not exercise unfair market power, ISO runs the integrated forward market. The integrated forward market’s main purpose is to economically schedule energy and ancillary services for the upcoming day.
The first thing the integrated forward market does is match all of the supply bids to all of the demand bids. The price at which the bids meet is the market clearing price for that interval.
It would be simple if the price for that interval applied for the entire ISO. And in an “ideal” grid with no transmission constraints or losses, it would. But unfortunately, transmission lines are only rated to flow a certain amount of power, and these lines become “congested” when they attempt to flow more power than they have the capacity to flow. When congestion occurs, the lowest-priced electricity can’t flow to a certain area to meet demand.
To address transmission and other system constraints, the integrated market run incorporates a computer model (sometimes called the “full network model“) that analyzes all transmission, generation, and other grid topology, and it runs an optimization algorithm – known as security-constrained unit commitment (SCUC) that creates schedules to serve energy at the lowest cost taking these constraints into account for each point on the grid. Instead of a single system-wide price like the original market clearing price defined from submitting bids and offers; the SCUC defines nodal prices for each location, or node, within the ISO’s domain. This “nodal price” is officially known as the locational marginal price (LMP), because it is the price that serves the very last (or “marginal”) megawatt of load at that node on the grid.
The Components of Locational Marginal Pricing:
The LMP has three components: the marginal cost of energy, the marginal cost of congestion, and the marginal cost of losses. The marginal cost of energy is equivalent to the market clearing price created when matching all supply and demand bids, and it is the same for all nodes. The marginal cost of losses is found by modeling actual power losses over transmission lines with the full network model. And the marginal cost of congestion is the difference between the system-wide marginal cost of energy (SMEC) and the “actual” marginal cost of energy at that node due to transmission constraints.
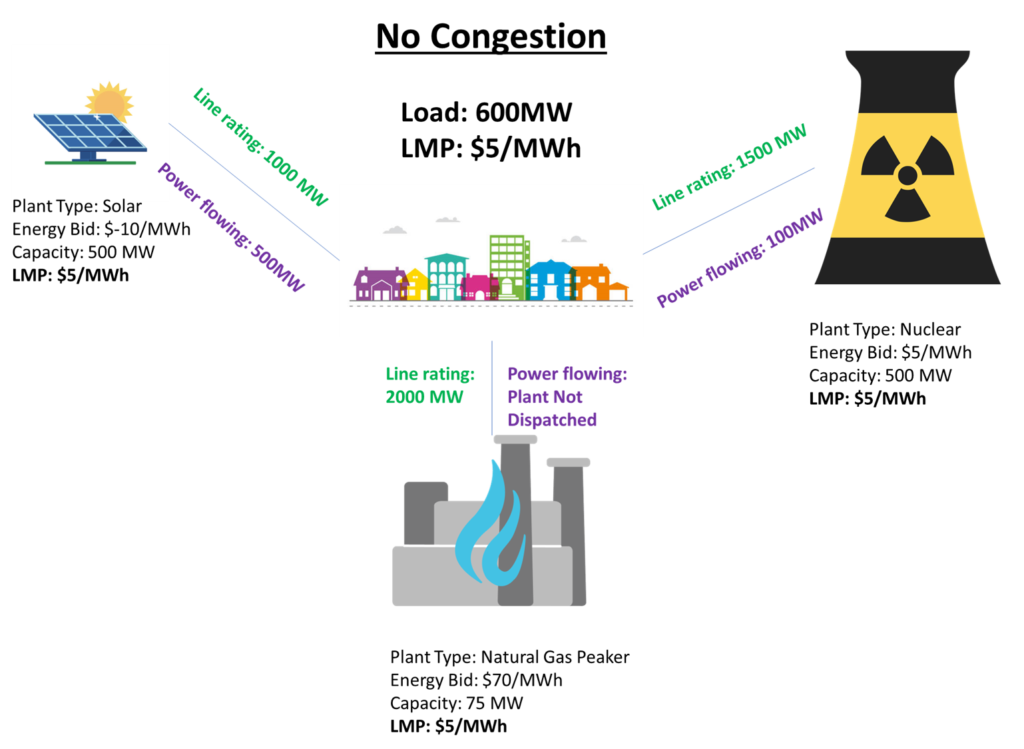
Below are two graphics showing how transmission constraints impact LMPs. When there is no congestion, the plants are dispatched from lowest bid to highest bid and all power flows freely across the grid. In the below example, 300 MW of load are served by 100MW of solar and 200MW of nuclear. The nuclear plant is the “marginal” generator because it provides the marginal megawatt to meet load. The natural gas peaker is not dispatched because the LMP has not reached its energy bid.
Now, consider some congestion on the transmission line connecting the solar farm to the load. As a result, the solar plant’s LMP is driven down to -$10/MWh, as it needs to economically curtail its output to generate at 50MW and not overload the line. The nuclear plant sends all of its generation to the load center, but the natural gas peaking plant must be dispatched to meet the final 50MW of load. As a result, the natural gas unit becomes the marginal MW for the unconstrained paths, and the LMPs at the load, nuclear, and natural gas plants are $70/MWh.

As a side note – yes, solar and wind plants often do have negative energy bids, meaning it will cost them money to sell power if they are the marginal generator. Production from wind and solar plants qualifies for additional financial products like production tax credits and renewable energy credits, so they can run at a profit even if they sell energy at negative prices. Hydroelectric and thermal plants don’t qualify for PTCs or RECs so they do not submit negative bids to ISOs.
Below is a real-life, weather-driven example of transmission congestion and its impact on LMPs in the real-time market. Due to its large solar resource, Southern California has far more energy than it could possibly use or export along transmission lines during the middle of the day. As a result, the LMP “lowers” through the bid curves for these plants, curtailing them from most expensive to least expensive, until it reaches the plant needed to supply the marginal megawatt of load.

Credit: California ISO
An useful way of visualizing generators and the marginal cost of energy is the concept of the “generation stack. The generation stack shows the relationship between the total generation, the marginal cost of energy, and the type of generating facility.
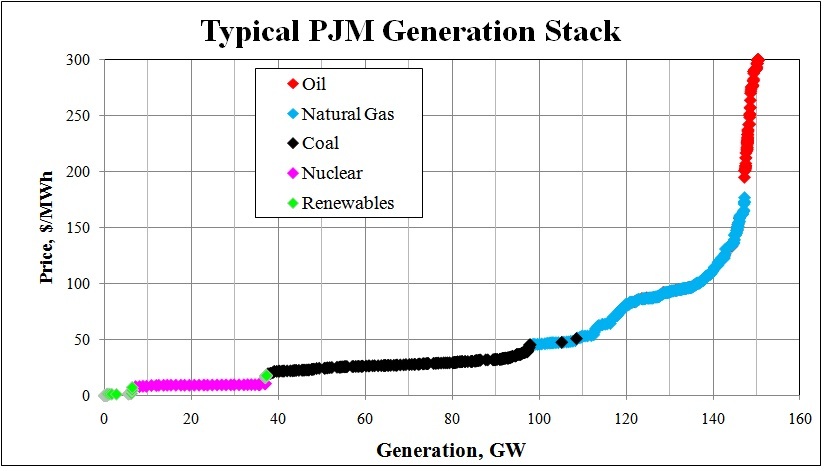
As the generation increases, the marginal cost of energy increases, because progressively more and more expensive plants must be dispatched to meet demand. And because demand is largely dependent on the weather, the marginal cost of energy in an RTO is also closely related to weather. This is becoming even more true as the percentage of energy generated from wind and solar increases.
Day-Ahead Awards and Ancillary Services
After the integrated forward market has run, different plants with supply bids into the day-ahead market are ‘awarded’ schedules to run if their nodal price cleared at or above any of the supply bid points. Likewise, those who submitted demand bids will receive a purchase if the nodal price of the location the power was purchased from cleared at or below any of the demand bid points.
Just like energy, ancillary services are also bid into the day-ahead market. Ancillary services are the suite of secondary services that help grid operators maintain the reliability of the electric grid, and they fit under two primary categories: regulation and reserves. Regulation services are used for balancing small mismatches between load and supply, and reverses are used as a contigency to bring large amounts of energy online if needed (for example, the loss of a large power plant in real-time). For example, the California ISO has four ancillary services: regulation up, regulation down, spinning reserve, and non-spinning reserve. I won’t get into the bidding structure for these here, but the main point is that the market takes these bids and gives ancillary service awards, just like it does for day-ahead energy awards.
The Real Time Market
While the purpose of the day-ahead market is to increase reliability by procuring large amounts of power in advance of when it is needed, the purpose of the real-time market is to reliably balance supply and demand in real-time at the lowest cost, given all grid constraints. Just like the day-ahead market, the real-time market requires generators, buyers, and sellers to submit energy bids into the ISO. But unlike the day-ahead market, which simply creates financially binding schedules of purchases and generation/sales, the real-time market actually governs how much electricity plants will physically put on the grid.
Similar to the day-ahead market, it does this by running an optimization tool to find the LMP for every node within the ISO, but unlike the day-ahead market, it sends a direct signal to a plant telling it to adjust its power output so that it is generating in accordance with its LMP and bid curve. The real-time market can even economically dispatch plants that are in service but offline if market prices reach a certain threshold. These dispatch instructions are known as DOTs, or “dispatch operating targets,” and the system responsible for moving the plants is called AGC, or automatic generation control. Just like the SCUC (security-constrained unit commitment) algorithm is responsible for scheduling generation and defining LMPs in the day-ahead market, the optimization algorithm responsible for determining the LMP in the real-time market is called security-constrained economic dispatch, or SCED. SCUC is responsible for scheduling generation in the day-ahead, but SCED is responsible for dispatching generation in real-time.
A key feature of the real-time market is that it operates in 5-minute intervals. This makes it easier to shuffle electricity around on the grid as needed to balance supply and demand within certain locations. In particular, it has substantially reduced the need to “curtail” excess wind and solar generation, as it is able to quickly export this energy to higher-demand areas. This has resulted in lower costs for consumers, higher revenues for wind/solar producers, and lower carbon emissions overall, and is one of the biggest success stories of deregulated power markets.
Conclusion:
Deregulated energy markets have increased competition and efficiency within the utility industry. Power providers compete to sell power to the wholesale market, retail providers compete to sell load to customers, and an ISO/RTO oversees the bulk electric system with sophisticated optimization tools that automatically dispatch the least-cost power to customers. There’s no question that well-designed deregulated markets lower power costs and carbon emissions by fostering competition amongst power providers, dispatching electricity in the most cost-effective way possible, and making it easier for renewable energy to become integrated into the grid.
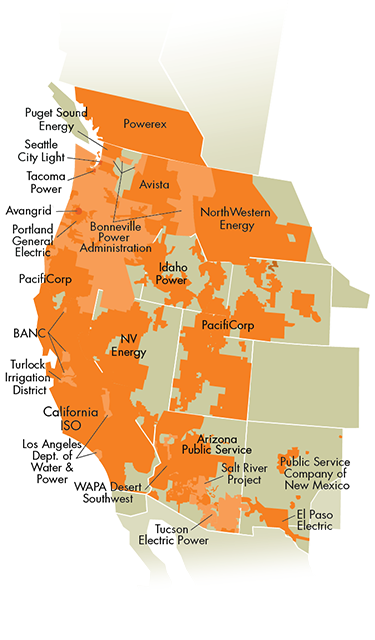
CAISO and SPP have made parts of their deregulated market services open to those in the Western U.S. CAISO’s “Western Energy Imbalance Market” (WEIM) is the extension of CAISO’s real-time market to other balancing authorities in the Western U.S, and per CAISO, it has accrued over $3 billion in benefits since its formation in 2014. SPP offers a similar service known as the “Western Energy Imbalance Service Market (WEIS),” and they currently developing their “Markets+” initiative, which bundles together SPP’s real-time, day-ahead, and ancillary services markets. I believe that the entire West will eventually transition to an RTO, but it will take some time to find a governance structure that all stakeholders can agree to.
Credit: CAISO
But just having a Western RTO isn’t enough. We need to reduce the constraints on the electric grid as well. And the biggest constraint of all right now is transmission capacity. RTOs are exceptionally adept at solving for constraints on the grid, but their full benefits will never be realized as long as these constraints remain in place. To truly make progress towards building a sustainable, resilient, low-cost, and low-carbon power system, we need to think about how to not only use deregulated markets to our advantage, but to reduce the system constraints that limit their efficacy.
Sources:
Bonnin, J. (2022, March 2). How locational marginal pricing (LMP) markets work. PCI. https://www.pcienergysolutions.com/2022/03/02/how-locational-marginal-pricing-markets-work/
Busby, J. W., Baker, K., Bazilian, M. D., Gilbert, A. Q., Grubert, E., Rai, V., Rhodes, J. D., Shidore, S., Smith, C. A., & Webber, M. E. (2021). Cascading risks: Understanding the 2021 winter blackout in Texas. Energy Research & Social Science, 77, 102106. https://doi.org/10.1016/j.erss.2021.102106
Cleary, K., & Palmer, K. (2022, March 17). US electricity markets 101. Resources for the Future. https://www.rff.org/publications/explainers/us-electricity-markets-101/
Coppa, J. (2020, May 21). Energy 101: What is the ISO/RTO? Best Practice Energy. https://bestpracticeenergy.com/2020/05/21/energy101-electricity-iso/
Daruwala, F. (2023, June 23). ISO markets and planning data. Independent Electricity System Operator. https://www.ieso.ca/-/media/Files/IESO/Document-Library/corporate/applications/PA-IESO-Markets-and-Planning-Data-JR-Report-20230623.ashx
Douglas, E. (2021, February 16). Texas power outage: Why natural gas went down during the winter storm. The Texas Tribune. https://www.texastribune.org/2021/02/16/natural-gas-power-storm/?utm_campaign=trib-social-buttons&utm_source=twitter&utm_medium=social
Energy Information Administration. (2014, October 28). Benchmarks play an important role in pricing crude oil. Energy Information Administration. https://www.eia.gov/todayinenergy/detail.php?id=18571
Federal Regulatory Energy Commission. (2020, April). Energy primer: A handbook of energy market basics. https://www.ferc.gov/sites/default/files/2020-06/energy-primer-2020.pdf
Hinman, C. (2019, December 2). CAISO Day-Ahead Market Overview. California ISO. http://www.caiso.com/Documents/Presentation-Existing-Day-Ahead-Market-Overview.pdf
Mukerji, R. (2023, July 31). Podcast ep. 27: Master Class in Electricity Markets with Rana Mukerji. NYISO. https://www.nyiso.com/-/podcast-ep.-27-master-class-in-electricity-markets-with-rana-mukerji
Pope, S. L. (2020, March 11). Transmission Congestion: why it occurs and causes locational differences in energy prices. Western EIM. https://www.westerneim.com/Documents/Presentation-Congestion-FTIConsulting.pdf
Posner, B., & Tayari, F. (n.d.). The fundamentals of electricity markets. E B F 200: Introduction to Energy and Earth Sciences Economics. https://www.e-education.psu.edu/ebf200/node/151
Power market structure. (2022, January 24). US EPA. https://www.epa.gov/green-power-markets/power-market-structure
Roberts, D. (2019, November 1). How to prepare PG&E and California’s power system for the 21st century. Vox. https://www.vox.com/energy-and-environment/2019/11/1/20934452/california-pge-power-system-21st-century
Taillon, J.-P. (2015, April 21). Introduction to the world of electricity trading. Investopedia. https://www.investopedia.com/articles/investing/042115/understanding-world-electricity-trading.asp
(2023). Western Energy Imbalance Market. https://www.westerneim.com/Pages/About/default.aspx